News
5 charts on Australian well-being, and the surprising effects of the pandemic

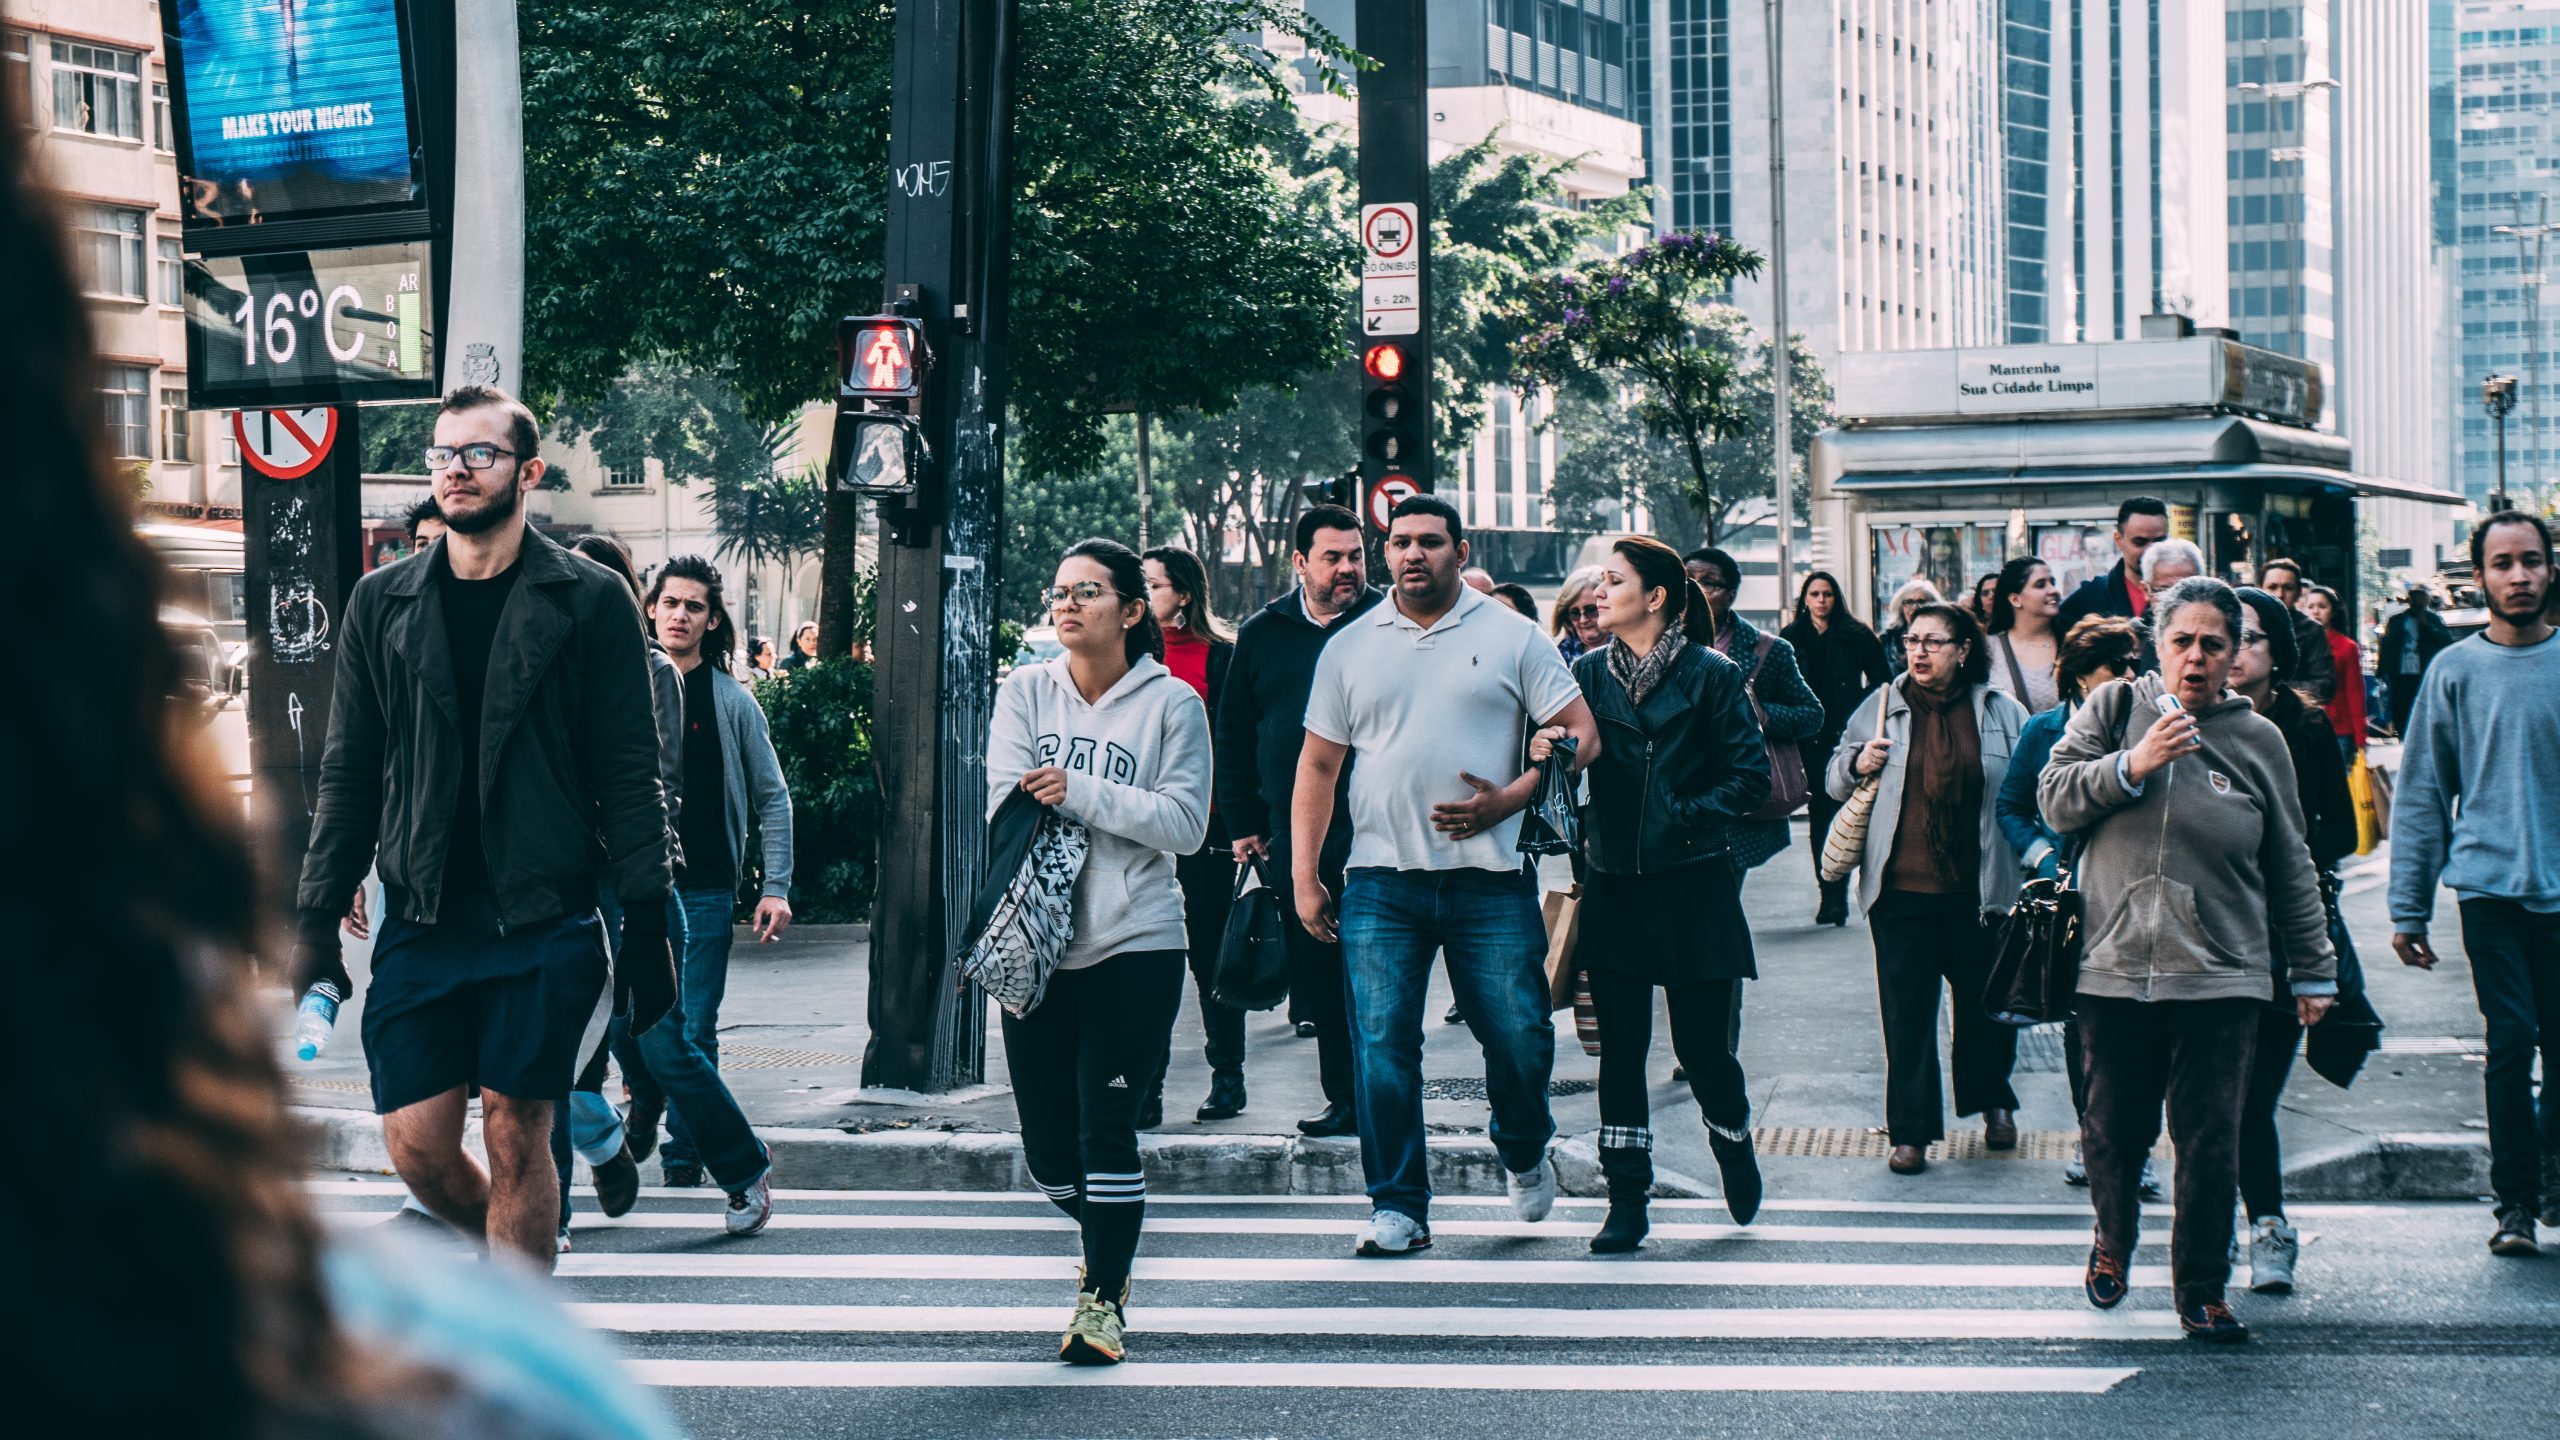
We’ve asked them through good times and bad, through wars and global financial downturns, fires and floods. (Pexels photo)
Since 2001 our research group has asked 2,000 Australians every year how they’re doing. Are they satisfied with their standard of living, their relationships, purpose in life, community connectedness, safety, health and future security?
We’ve asked them through good times and bad, through wars and global financial downturns, fires and floods. And now through years of pandemic – the worst economic crisis in a generation, and the worst health crisis in a century
Using an internationally regarded methodology, we combine their subjective ratings across seven life areas into a single score out of 100. These results form the basis of the Australian Unity Wellbeing Index, a collaborative partnership between Deakin University and mutual company Australian Unity.
Our latest results may surprise you. Over the pandemic Australians’ average subjective well-being has barely deviated from remarkably stable levels maintained over 20 years.
That doesn’t make for an exciting graph. But it is significant.
It shows that while well-being is, on average, quite high, it won’t get any better by just continuing along the same path.
This is where our survey gets more interesting. Beneath the headline result is a more pronounced story – of notable differences in people’s subjective well-being based on their circumstances and life experience.
In these differences lie important lessons about the need to look beyond averages as a measure of a nation.
Why is average well-being so stable?
First, though, it’s worth understanding why the national average score is relatively high, and so stable. This pattern is consistent with life satisfaction scores across most OECD countries.
It reflects both biological and situational factors.
At the biological level it is thought that humans have evolved to maintain a relatively optimistic and happy mood. This is controlled by homeostatic mechanisms like those that maintain an optimal body temperature.
But like body temperature, well-being can be undermined by situational factors. In particular, it declines without sufficient levels of three key resources: enough money, connection with others, and a sense of purpose.
Because not everyone has equal access to these resources, inequities drive very different patterns of well-being in disadvantaged groups.
Well-being by living arrangements
Our second graph shows subjective well-being levels by living arrangements. These are perhaps our most predictable results. Those living alone, in share houses and single parents have the lowest scores overall. But there are also less intuitive results, with the well-being of those living alone and single parents increasing significantly in 2020.
Perhaps because these groups are more likely to be socially isolated, the effects of lockdowns had less impact. But the more obvious reason is likely to do with income, as our next graphs show.
Well-being by occupation
Year in, year out, certain groups show lower levels of subjective well-being. Most evident are those who are unemployed. But in 2020 this group reported considerably better well-being – nine percentage points higher than 2019.
There are three possible explanations. First, the composition of the unemployed cohort changed due to pandemic-related job losses. Second, the stigma of being unemployed was reduced.
The third reason, however, seems most obvious. In 2020 the JobSeeker payment was doubled from $550 to $1,100 a fortnight. For those struggling to even pay for necessities such as rent and food, this would have been a huge relief.
However, in 2021, the JobSeeker payment was cut back to about $620 a fortnight. At the same time well-being for those who were unemployed fell. To a level lower than in 2019 in fact.
This is consistent with economic theory of loss aversion – that people feel losses more deeply than gains in income.
Losing really hurts
Our next graph demonstrates this loss-aversion effect. Those who lost income during the pandemic reported lower well-being than the national average. But those whose household income increased during the pandemic reported well-being levels identical to those whose income remained the same.
Marginal diminishing gains
Our final graph shows well-being levels by income. The largest well-being increases were in the lowest-income households in 2020. Well-being for those on the highest incomes didn’t change.
Thus, governments allocating more money to people who already have their financial needs met is unlikely to improve subjective well-being. On the other hand, lifting people out of poverty is likely to make a big difference to their well-being.
The importance of measuring well-being
These results show why it is important to look past headline figures, such as GDP or national averages, to judge whether policies and programs are actually contributing to well-being and societal progress.
This is why countries such as New Zealand, Scotland, Wales, Iceland and Finland are now incorporating well-being measures into their budgets and policy frameworks. Like the OECD, these countries have recognised that improving the well-being of society, particularly of disadvantaged groups, is a core marker of societal progress.
We’d like to see Australia do the same.![]()
This article is republished from The Conversation under a Creative Commons license. Read the original article.


