News
Roadside safety messages increase crashes by distracting drivers

(Callum Blacoe/Unsplash)
Behavioural interventions involve gently suggesting that people reconsider or change specific undesirable behaviours. They are a low-cost, easy-to-implement and increasingly common tool used by policymakers to encourage socially desirable behaviours.
Examples of behavioural interventions include telling people how their electricity usage compares to their neighbours or sending text messages reminding people to pay fines.
Many of these interventions are expressly designed to “seize people’s attention” at a time when they can take the desired action. Unfortunately, seizing people’s attention can crowd out other, more important considerations, and cause even a simple intervention to backfire with costly individual and social consequences.
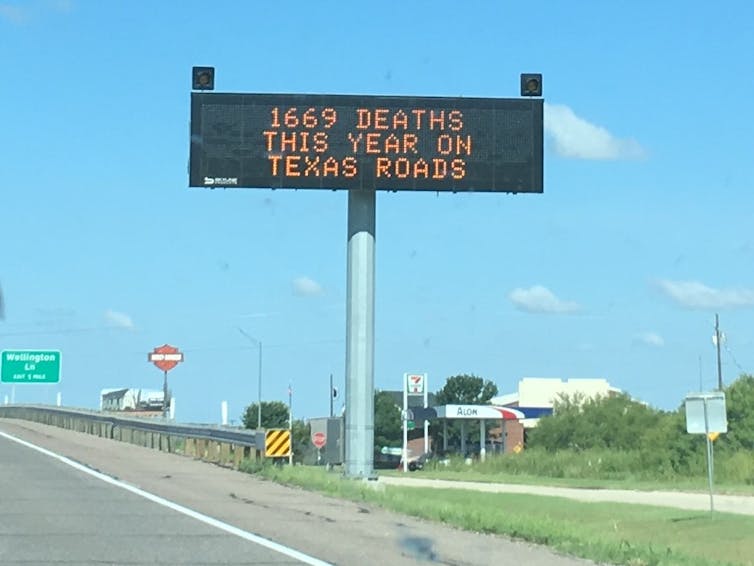
One such behavioural intervention struck us as odd: Several U.S. states display year-to-date fatality statistics (number of deaths) on roadside dynamic message signs (DMSs). The hope is that these sobering messages will reduce traffic crashes, a leading cause of death of five- to 29-year-olds worldwide. Perhaps because of its low cost and ease of implementation, at least 28 U.S. states have displayed fatality statistics at least once since 2012. We estimate that approximately 90 million drivers have been exposed to such messages.

(Jonathan Hall), Author provided
Startling results
As academic researchers with backgrounds in information disclosure and transportation policy, we teamed up to investigate and quantify the effects of these messages. What we found startled us.
Contrary to policymakers’ expectations (and ours), we found that displaying fatality messages increases the number of crashes.
We studied the use of these fatality messages in Texas. The state provides a useful laboratory to study such messages, as it has 880 DMSs, 17 million drivers and, unfortunately, typically over 3,000 road-related fatalities per year. The most advantageous aspect of this sample, however, is that from August 2012 until the end of our sample in 2017, the Texas Department of Transportation only showed these fatality messages for one week each month — the week before the Texas Transportation Commission’s monthly meeting.
This institutional feature allowed us to compare, for instance, the hourly number of crashes occurring around a DMS during the week when fatality messages are being shown, relative to crashes on the same road segment during the other three weeks of the same month. Also, we were able to control for time of day, day of week, weather conditions and holidays.
We found that there were two to three per cent more crashes within one to 10 kilometres downstream of each DMS during the week fatality messages were shown. This suggests that this specific behavioural intervention backfired in Texas.
Warning distractions
We conducted two tests to rule out whether this finding was simply because these weeks happen to be inherently more dangerous. First, we looked upstream of each DMS. In doing so, we limited our sample to those DMSs without another DMS within 10 kilometres upstream. We found no increase in accidents upstream of these DMSs, but still find an effect downstream.
Second, we investigated whether the weeks before the monthly meetings of the Texas Transportation Commission had more crashes in the months before Texas began showing these fatality messages. Looking at data between January 2010 and July 2012, we found no evidence of a change in crashes during the week prior to the Texas Transportation Commission meeting.
Based on our findings, we hypothesized that these fatality messages cause more crashes because they make drivers anxious and distract them. Our research found several pieces of evidence that supported this hypothesis.
First, we found that the larger the displayed number of fatalities (a plausibly more shocking and distracting message), the greater the increase in crashes. Higher fatality counts are associated with significantly more crashes, whereas lower fatality counts are associated with fewer crashes.
Related, fatality messages cause the largest increase in crashes in January, when the display shows the prior year’s total in Texas. Conversely, there are marginally fewer crashes in February, when the fatality count resets and is at its lowest.
Second, the increase in crashes is concentrated in more complex road segments, where focusing on the road is likely more important and the cost of a distraction more severe. We also found that crashes increased statewide during the weeks when messages were displayed, inconsistent with improved driving farther away from DMSs; that the days after a campaign end are no safer than other days; and that these messages continue to affect drivers after more than five years of showing fatality statistics.
Counterproductive to safety
Our research shows that displaying fatality messages does not result in safer driving and fewer crashes. Besides the more obvious takeaway that displaying fatality messages may be counterproductive, our findings highlight two broader issues.
First, while behavioural interventions should grab attention, this can be taken too far and have costly consequences. Second, it is vital to evaluate policies and their outcomes over time, as even good intentions may not necessarily lead to the desired outcomes.![]()
Jonathan Hall, Assistant Professor, Economics, University of Toronto and Joshua Madsen, Assistant Professor, Accounting, University of Minnesota
This article is republished from The Conversation under a Creative Commons license. Read the original article.


