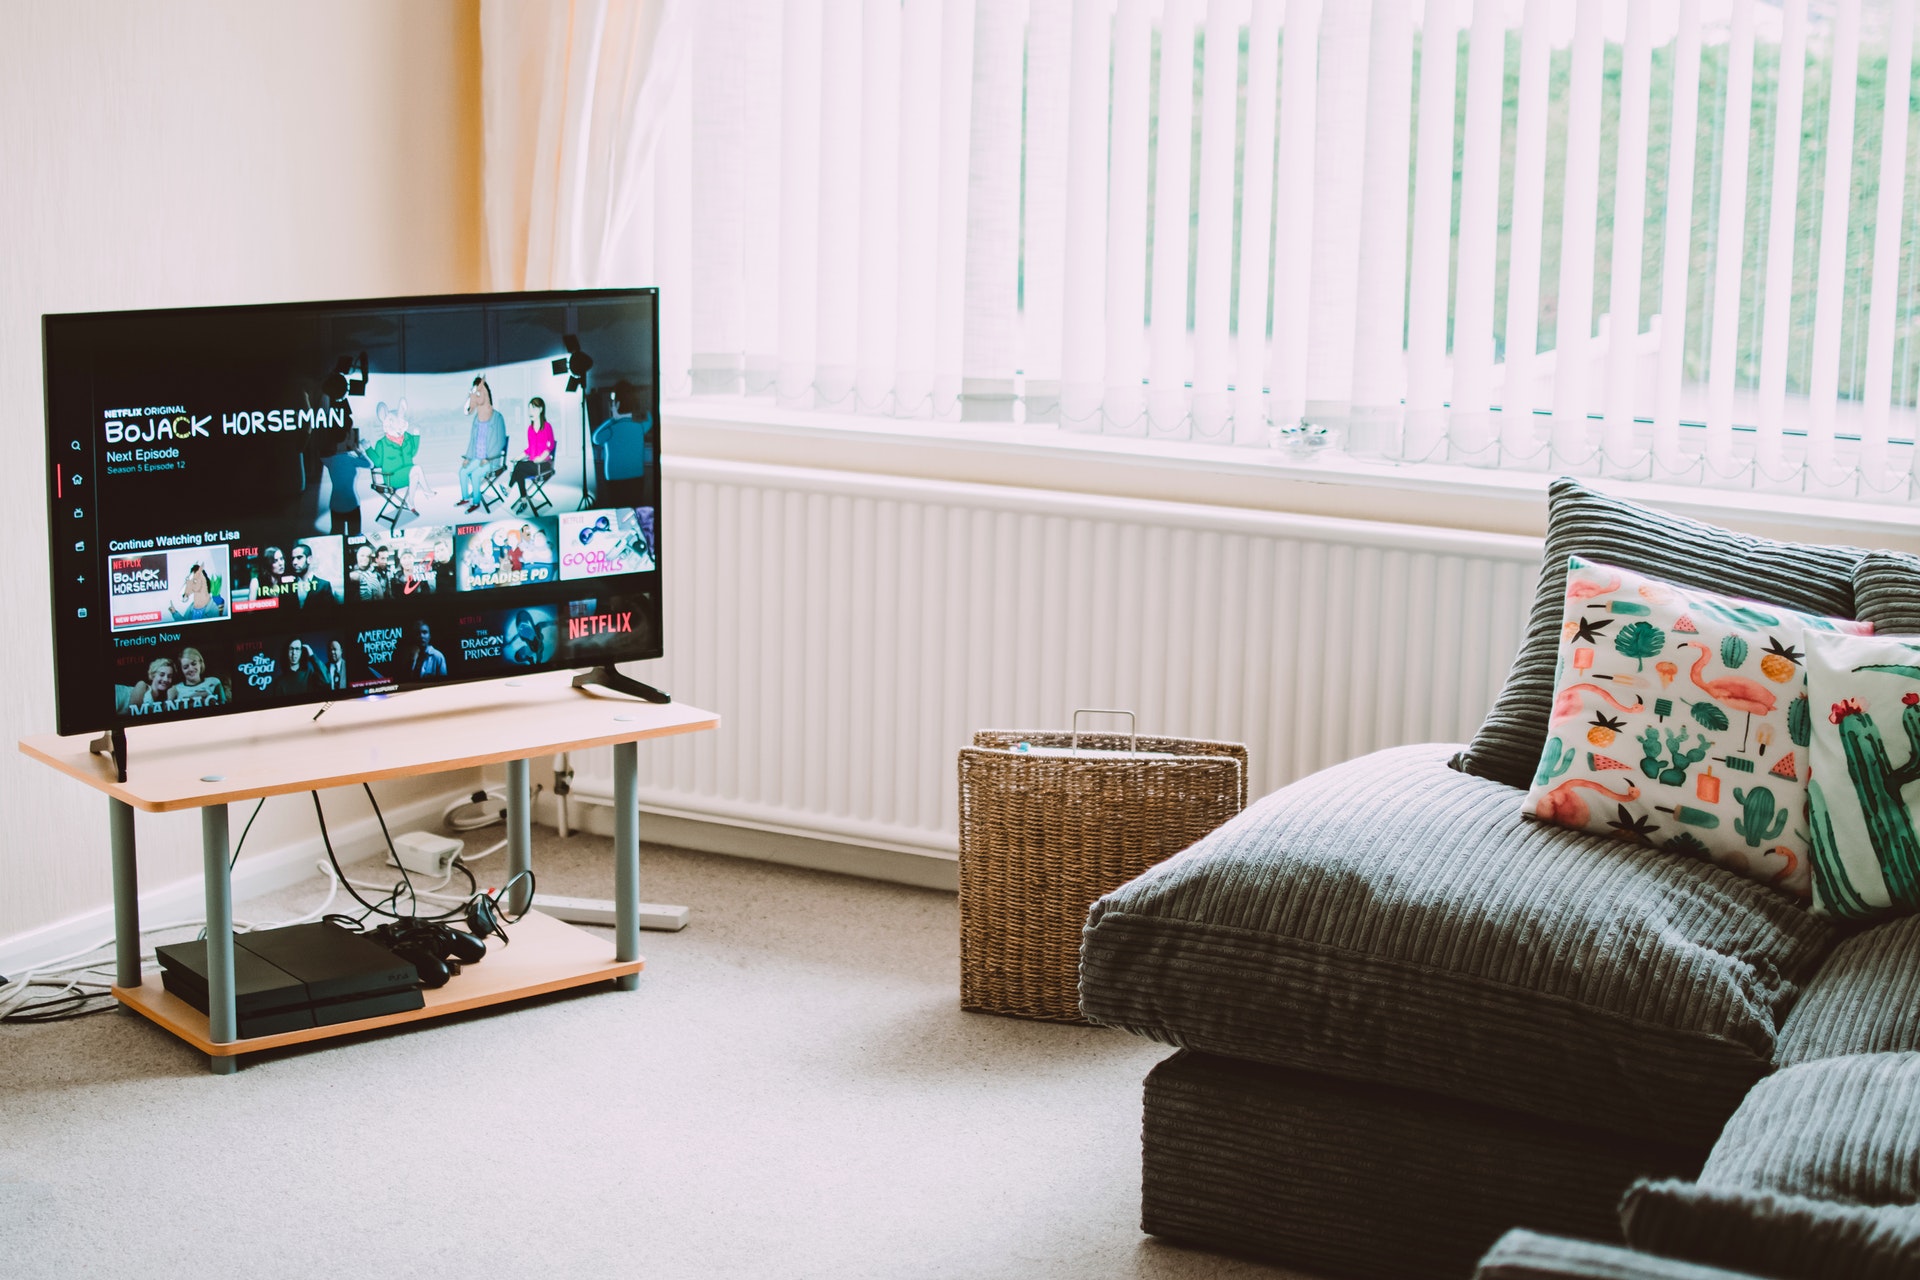
NEW YORK — Streaming services like Netflix or Hulu account for 19% of television viewing in the United States now for people who have that capacity, virtually double what it was less than two years ago, a report out Wednesday said.
A Nielsen company study illustrated how quickly consumers have embraced streaming as an alternative to live TV. The percentage of time spent streaming has gone from 10% in a Nielsen study from March 2018 to 19% during the last three months of 2019.
More than half of consumers with the capacity to stream subscribe to two or more services, Nielsen found. And, in a survey, 93% said they planned to either increase or maintain that number.
“There is room for growth there,” said Pete Katsingris, Nielsen’s senior vice-president for audience insights.
The average American spends a staggering 11 hours, 54 minutes each day connected to some form of media — TV, smartphones, radio, games — although that number is bloated because some of the usage is simultaneous, Nielsen said. That’s up nearly an hour and a half in only a year.
Smartphone usage accounts for virtually all of the increase. People spent just under four hours a day on their phones in Nielsen’s most recent study, compared to 2 hours, 31 minutes in the last three months of 2018.
A walk through the train on his daily commute shows Katsingris how absorbed people are in their phones, and they’re becoming increasingly comfortable using them to watch video, he said.
“They are finding more and more ways to keep their attention occupied,” he said.
Live television viewing is actually down in the past year (3 hours, 44 minutes to 3 hours, 27 minutes), explaining the worry in executive suites at television networks. Streaming time is up, from 29 minutes a day to 38 minutes in the same period.
Nielsen’s report also illustrates a technological generation gap. People aged 18 to 34 spend five and a half hours a week on an Internet-connected device, compared to two and a half hours for people over age 65. Meanwhile, older folks spend nearly 50 hours a week in front of the television, compared to 20 hours for young people.
It’s not like there’s nothing to watch: Nielsen said consumers had access to 646,152 different movies or TV programs last year, up 10% in only a year.
There’s something to be said for familiarity. Nielsen said the five most-watched programs on Netflix during the last three months of 2019 were episodes of programs that began on broadcast network TV: “The Office,” “Friends,” “Criminal Minds,” “Grey’s Anatomy” and “NCIS.”