Canada News
Oil spill in Vancouver waters would quickly stain beaches: Analysis
VANCOUVER — Oil pipeline opponents have developed computer-animated models illustrating how rapidly Vancouver’s inlets and beaches could become coated in crude under a worst-case oil tanker spill scenario.
The analysis, which claims between 50 per cent and 90 per cent of spilled oil could spread to shorelines within 24 hours, will be submitted in a bid to block the expansion of Kinder Morgan’s Trans Mountain pipeline.
The City of Vancouver, City of Burnaby and Tsleil-Waututh Nation commissioned the analysis based on their view that the pipeline infrastructure firm has failed to adequately study potential consequences of a spill.
The National Energy Board will consider evidence that will determine the project’s future.
“We hope that (the models) will help both the NEB and all the residents of the region better understand the risks of oil spills,” said John Konovsky, a technical advisor with the Tsleil-Waututh Nation. “Our position is that we oppose the expansion.”
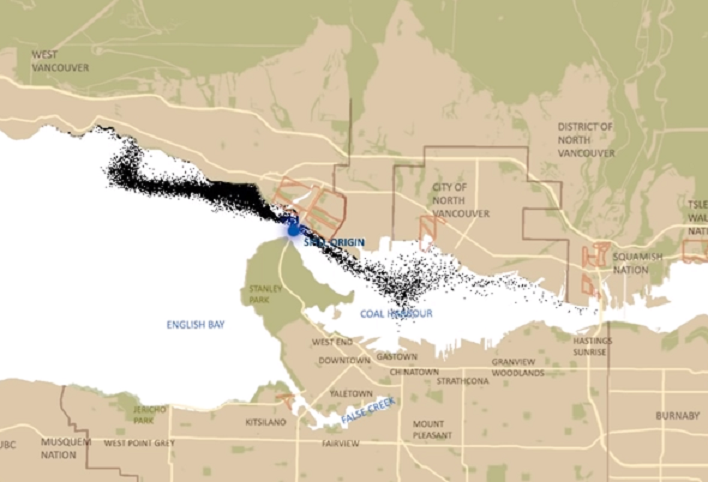
One animation, posted online, shows a cluster of black dots spewing out from a theoretical ground zero, surging into open water and then dispersing into flecks that settle into dark outlines along the land.
The ebb and flow projected by the 72-hour time-lapse, driven mainly by tidal currents and winds, looks like a swarm of blackflies spreading across Vancouver’s English Bay and harbour.
That model puts the spill epicentre below the Lions Gate Bridge, at the First Narrows in Burrard Inlet, considered one of the most difficult and dangerous regions for outgoing ships to navigate.
“Watching it, it’s hard not to feel concerned,” said Vancouver City Councillor Andrea Reimer, who drew a link between the animation to a much smaller spill in Vancouver’s harbour.
The MV Marathassa leaked about 2,700 litres of bunker fuel into the waters of the city last month. The coast guard has estimated at least 90 per cent of the spill was recovered.
The city has said a clean up response by federal agencies was insufficient.
“When you look at the time delay (in this model), this oil, up to 90 per cent could be on shorelines within hours? The response wasn’t even in place within hours,” Reimer said.
It took more than four hours for an emergency response team, directed by the Canadian Coast Guard, to arrive after the fuel leak was first reported on the evening of April 8. A boom fully encircled the vessel by 6 a.m. the next day.
Beaches were closed for ten days, while two in Vancouver and several in West Vancouver remained under health advisories.
A single black dot in the animation represents slightly less than the volume of fuel spilled by the Marathassa. The model, conducted by Genwest Systems, predicts a worst-case spill of 16 million litres, which is about one-fifth the quantity of oil on an average tanker.
The oil movement in the animation does not factor in the impact of cleanup.
A proposed expansion of Kinder Morgan’s Trans Mountain oil pipeline would triple the output currently leaving the harbour and is projected to increase tanker traffic in Burrard Inlet to 34 vessels each month.
Ali Hounsell, spokeswoman for the expansion project, said the firm has in fact submitted detailed risk assessments of potential spills to the NEB.
She wonders if the new modelling accounts for the fact that other vessels’ movements are restricted when an oil tanker passes and that ships would be escorted by tugs.
Hounsell also notes the model doesn’t factor in clean up response.
“If we can learn something from each other’s studies, then we would certainly look at how we can incorporate that into our project to make it better.”
The animation can be viewed below:


