Headline
SWS: Majority of Filipinos satisfied with democracy

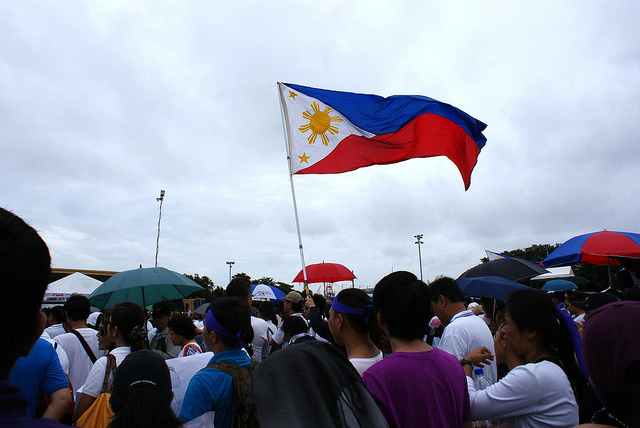
Majority of Filipinos are satisfied with how democracy works in the Philippines, according to the latest survey of Social Weather Stations (SWS) released on the 120th celebration of the country’s Independence Day, June 12. (Photo by James Sarmiento/Flickr, CC BY 2.0)
Majority of Filipinos are satisfied with how democracy works in the Philippines, according to the latest survey of the Social Weather Stations (SWS) released on the 120th celebration of the country’s Independence Day, June 12.
The First Quarter 2018 Social Weather Survey revealed that 78 percent of adult Filipinos are satisfied with the way democracy works in the country.
This result is a two-point decrease from the 80 percent in June 2017, and a point lower than the 79% in June 2016.
The pollster noted that public satisfaction with the way democracy works reached 70 percent in September 1992, 70 percent in July 1998, 68 percent in June 2010, and the record-high 86 percent last September 2016, following the “successful” presidential elections of 1992, 1998, 2010, and 2016, respectively.
However, this satisfaction with the way democracy works in the Philippines obtained a ‘disappointing’ 44 percent in June 2004, after the presidential election of that year.
Respondents in the SWS’ latest survey were asked, “Sa pangkalahatan, kayo po ba ay… (Lubos na nasiyahan; medyo nasisiyahan; lubos na nasisiyahan) sa takbo ng demokrasya sa Pilipinas (On the whole, are you … (Very satisfied; Fairly satisfied; Not very satisfied; Not at all satisfied) with the way democracy works in the Philippines)?”
“The question on ‘satisfaction in the way democracy works’ originated in the Eurobarometer surveys, and is also in standard use in Latin American and Asian barometer projects,” the SWS said.
Democracy remains as ‘best’ form of gov’t
For 60 percent of Filipino adults, democracy “is always preferable to any other kind of government,” the same survey revealed.
This proportion, according to SWS, barely moved from the 61 percent recorded in June 2017 to 60 percent in March 2018.
Meanwhile, preference for authoritarian government has been steady at 19 percent from September 2016 to March 2018, below 20 percent for five consecutive quarters since December 2015.
The pollster also noted that Filipino adults who said “for people like me, it does not matter whether we have a democratic or a non-democratic regime” hardly changed from 20 percent in June 2017 to 21 percent in March 2018.
“It has been 20% and above in 6 out of 7 surveys since September 2013,” the SWS said.
The respondents, on preference for democracy, were asked, “Alin sa mga sumusunod na pangungusap ang pinakamalapit sa inyong opinyon? [Ang demokrasya ay palaging mas kanais-nais kaysa sa ibang klase ng pamahalaan; sa mga ilang situwasyon, ang pamahalaang diktaturya ay mas kanais-nais kaysa sa isang demokratiko; para sa mga taong katulad ko, walang kabuluhan sa akin kung ang ating pamahalaan ay demokratiko o hindi demokratiko] (Which of the following statements comes closest to your own opinion? (Democracy is always preferable to any other kind of government; Under some circumstances, an authoritarian government can be preferable to a democratic one; For people like me, it does not matter whether we have a democratic or a non-democratic regime).
“
The SWS’ latest survey, conducted from March 23 to 27, used face-to-face interviews of 1,200 adults (18 years old and above) nationwide, with sampling error margins of plus-minus three percent for national percentages and plus-minus six percent each for Metro Manila, Balance Luzon, Visayas, and Mindanao.


